Unleash the Power of Your Imaging Photometer or Colorimeter
Photometrica software unleashes the power of your Westboro Photonics imaging photometer or colorimeter. Photometrica ships as standard with all Westboro camera systems and allows you to measure and report 2D luminance, illuminance and colour from literally millions of locations in an instant. Imaging photometers and colorimeters can be used to test automotive and avionics displays and controls, vehicle exterior and interior lighting, near-to-eye displays, flat panel displays, the lit area uniformity of lighting products and the projected beam pattern analysis of lamps and LEDs. With an optional conoscopic lens, they can also be used to measure the view angle performance of displays. Application-specific software bolt-ons are available for Photometrica that simplify the measurements of head-up displays, automotive headlamp beam patterns, for display testing, for light plate balancing of avionic cockpit displays, for backlit switch and control graphics and for the lit area analysis of vehicle and architectural lighting features.
Measurement Capabilities
The following photometric, colorimetric and radiometric parameters can be measured using a Westboro camera under the control of Photometrica software:
Photometrica Software Bolt-Ons
Although the standard Photometrica Software tools will cover almost any scenario, specialised packages with a streamlined user interface are available for a number of applications including the assessment of luminance and colour uniformity of graphics, mura and defects of displays, and luminous intensity distributions of lamps. These application-specific packages are designed to save you time, providing you with the functionality required for your specific testing needs.
For details on each of the optional software packages, click on the relevant tab to left.
Photometrica User Interface
Create and save your own custom layout and preferences to suit your application and personal style within the easy-to-use software. Define window positions, sizes, docking, tabbing or pinning for optimal workflow.
Software Development Kit (SDK)
The Software Development Kit (SDK) allows the creation of unique custom windows. Learn more about the tools, libraries, and code samples available by clicking on the Customisation & SDK tab to the left.
Multi-Measurement Documents
Contain multiple measurements within the same document for easy comparisons and simultaneous plotting. Perform computations between measurements in a document to generate new measurement components such as contrast or ΔE*ab.
Software PC Requirements
Photometrica will run with less than 16 GB RAM, however processing speeds may be reduced due to disk caching when using large data sets.
 Photometrica Core Features: Measurements
Photometrica software offers a complete set of controls for both the live preview and capture of measurements. Align and focus the instrument via the Preview function’s live video stream, while the Capture Editor manages the key measurement parameters such as exposure time.
Luminance
All Westboro Photonics imaging photometers and colorimeters measure luminance (Y) at high spatial resolution. Other photometric quantities that can be derived from luminance (cd/m2 or fL) include luminous intensity (cd) and partial luminous flux (lm). Alternatively, measurements of spatial illuminance (lux) can be performed provided you have the ability to calibrate your projection screen.
 Chromaticity
View chromaticity measurements in CIE colour space diagrams such as (x, y), (u’, v’), and various plots within Photometrica Software.
Westboro Photonics imaging colorimeters come as standard with four special filters to match the CIE tristimulus functions: two for the X channel (Xblue and Xred) and one for each for Y and Z. For speed-optimised production applications a three-filter solution, where the Xblue component is estimated from Z, is supported.
Additional Filter Support
Photometrica supports other filters installed in photometers and colorimeters for various applications. Filter types include scotopic, radiometric, bandpass, shortpass or longpass, ipRGC, S cone, M cone, and L cone.
Computed Measurements
Available computed quantities include the following parameters. All spectral quantities require that you use an optional, integrated spectroradiometer. For the reporting of intensity and illuminance, you will need to calibrate the gain of your projection screen.
Custom computations can be generated to compute user-specified measurement components on a pixel-wise basis.
Spectral Measurements
The WP512 and MCIC-S imaging colorimeters have an integrated spot spectroradiometer providing automatic colour correction, and markedly improving accuracy. Benefit from fast spectral preview, spectral radiance graphing, tabulated measurement results from the spectra, and more.
 Photometrica Core Features: Analysis
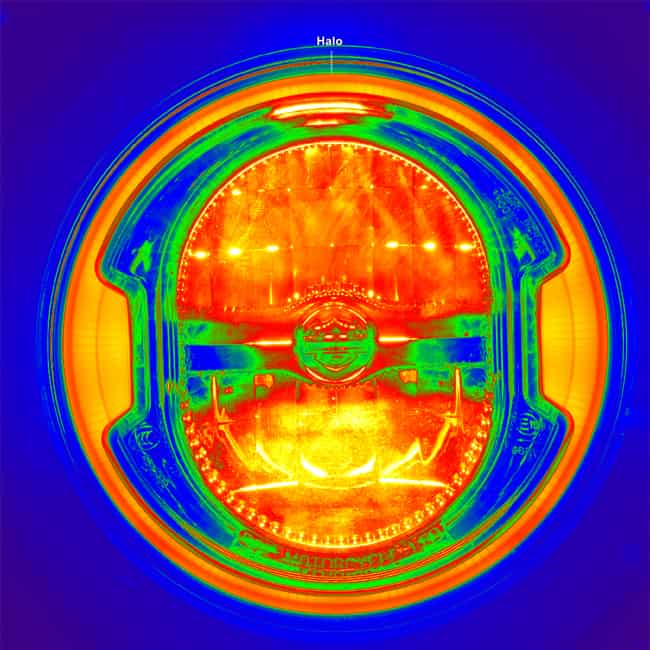
Take advantage of an easy-to-understand psuedo-colour data map by leveraging the Workspace Window. Benefits of this optimised visual presentation include:

Area of Interest (AOI)
An Area of Interest (AOI) is a region of pixels at a specific location. The set of pixels may be defined by a distinctive shape, such as a rectangle, or by a process such as refinement. The pixels of an AOI do not need to be connected. Once created, the AOI’s properties are available to display in the AOIs Table.
Refinement
To precisely define areas of interest, sophisticated refinement methods can be used to segment regions of the measurement based on luminance or colour characteristics. For example, refinements may be based on simple minimum or maximum luminance thresholds, colour regions, or custom formulas that define the inclusion criteria. Erosion and minimum area may also be specified as secondary refinement parameters. Once a refinement is created, it can be set to be applied automatically to segment the measurement into AOIs after each measurement.
 Computed Measurements
For imaging colorimeters and photometers, standard computed measurements include x, y, u’, v’, CCT, dominant wavelength and purity. Create any custom measurement using pixel-wise computations, including:

Colour Space
Display CIE 1931 (x, y) or CIE 1976 (u’, v’) colour spaces in the Colour Space Window. This window allows the user to:

Line Profiles

Isolines
Show contour lines in an overlay for any measurement. The contours can be set to persist when other measurements are active, for example, the 1000:1 contrast ratio contour line (from the computed contrast measurement) can be active while viewing the white luminance measurement.
Histograms
Select a region and measurement to analyse the distribution of data using a histogram. Features include multiple cursors, logarithmic or linear scaling for both axes and up to 500 bins. Additionally, directly create a refinement by using a histogram, making a data-driven decision on where to put the threshold(s).
Pass/Fail Analysis
Most production applications require the specification pass/fail metrics which must be passed for the part to move on to the next step in the production process. This type of analysis ensures quality of the final product and efficiency throughout the process. Photometrica Software incorporates an assortment of methods to compute the critical values and output the results with pass/fail information. Some examples of reporting include:

Surface Plots
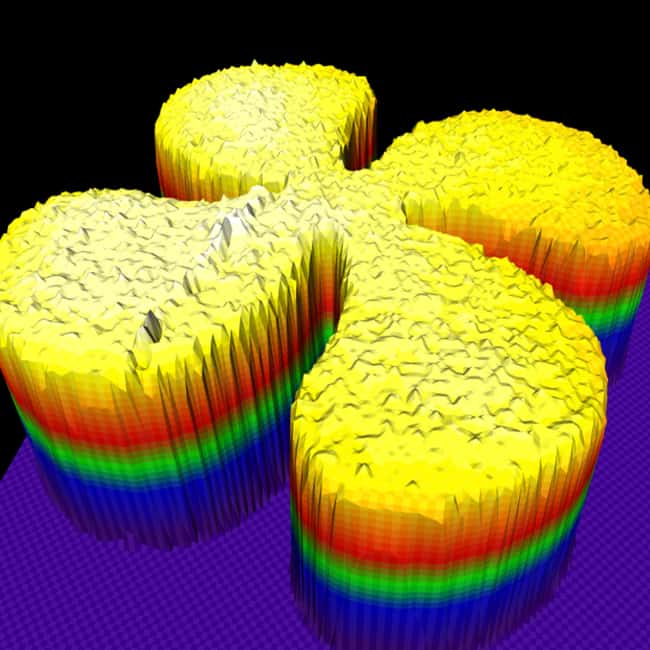
Plot a three-dimensional representation of any selection for the active measurement. By default, the extents of the plot are determined by the active selection area, and if there is no selection, then the entire measurement is represented. The surface plot will refresh itself whenever the active measurement or selection changes.
Meta Data Reporting
A unique feature of Photometrica Software is that a document may have multiple measurements. A useful example of this capability could be measurements of a scene at different times, voltages or grey levels. Select any measurement to be active and display its data. Also unique to Photometrica Software is the ability to plot the data within on AOI across multiple measurements using the Meta Plot Window. In the meta plot, the horizontal axis (independent variable) is a unique meta measurement variable (such as time, voltage, grey level) which changes between measurements. Also, any AOI statistic can be plotted. In this way you can readily analyse complicated data sets within the software.

 Photometrica Core Features: Report Generation
Organise all document element data and information, including the order in which they are displayed, into reports generated from Photometrica Software templates that can be saved as PRT files. The Reports Window provides a list of all existing report templates within the document and enables access for editing purposes.
The Photometrica report editor allows you to generate and modify a report template via the Report Editor Window. This window is accessed by clicking the Add New toolbar icon in the Reports Window.

 Photometrica Core Features: Customisation & SDK
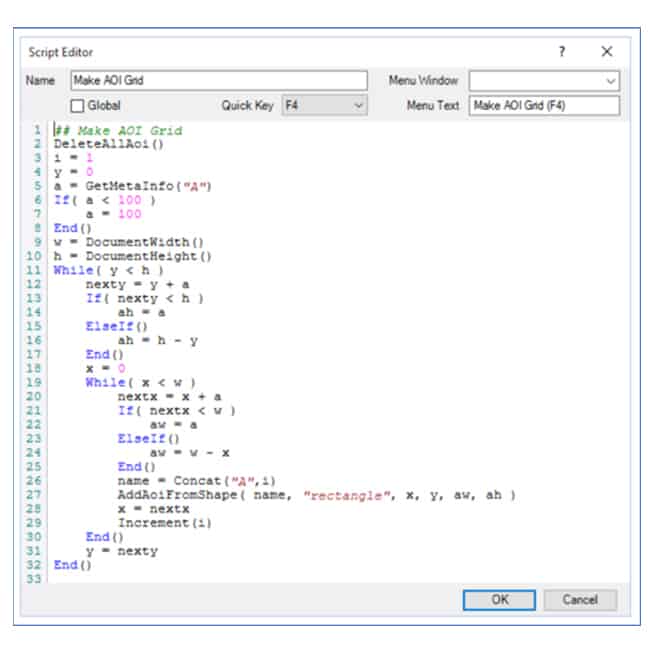
Customise your Photometrica Software by creating scripts to perform a specific set of actions. Depending on your requirements this may simply be the customisation of the user interface by writing a number of scripts. These scripts come in three types that dictate when they are loaded, saved and unloaded: Document; Global; and Package.
Most of the Photometrica API (Application Programming Interface) methods are available in scripts as well as through the COM/.NET and SOAP interfaces.
Third Party Software Support
Use Photometrica Software on an assembly line or as a part of a larger system or application that requires external software control. The following options are available:
Templates
Quickly create new documents with a set of existing templated elements such as: capture schemes; computations; reports; a predetermined set of columns in the Area Of Interest (AOI) table; evaluation entries; and more. Photometrica’s SDK allows the creation of user-defined windows and scripts which can be included with the template.
Photometrica Development Services
Westboro Photonics offers Photometrica Software development services including building custom applications or add-on packages for Photometrica based on your specifications, as well as blocks of Technical Support that you can use to assist with your own customization efforts. Contact SphereOptics for additional details.
 Simplify the Testing of Displays in Production
The optional Photometrica Display Testing Software Package provides for quick and intuitive testing of displays in a production environment. This bolt-on software ensures displays are properly calibrated for colour and luminance and that there are no critical defects. Follow a simplified 3-step process using an intuitive suite of tools to efficiently define test parameters, configure active regions and execute tests.
Key Features
 Simplify the Measurement of Graphics Icons
The optional Photometrica Graphics Testing Software Package provides for the fast identification and analysis of graphics icons, automatically isolating the relevant lit areas from the dark background based upon local threshold levels instead of global thresholds. The Graphics Testing Package method also uses local luminance statistics and spatial filtering to better determine the edges of the graphics.
Key Features
 Simplify the Measurement of Display Uniformity
The optional Photometrica Uniformity Spots Testing Software Package provides for the fast uniformity analysis of any display. Luminance and chromaticity uniformity are two of the most important characteristics of displays and backlights. Uniformity is typically measured using a fixed grid of test locations in the display area. As a Uniformity Spots Package user, follow a simplified process to:
The software re-registers the AOI array for each measurement, making highly accurate fixturing unnecessary. Both rectangular and irregularly shaped displays are supported.
 Key Features
Watch a video of the Uniformity Spots Test Package in action.
 Simplify the Production of Avionics Displays & Controls
The optional Photometrica Light Plate Balancing Software Package simplifies the production of avionics displays and controls. Backlit graphics in avionic cockpit displays are commonly built with light panels. The backlit graphics of the light panels must have uniform luminance, and to achieve this uniformity, it is necessary to “balance” the panel before it is finished with an opaque topcoat. Balancing entails adding layers of white paint to the areas that are too bright until all areas of interest are within the desired luminance range(s).
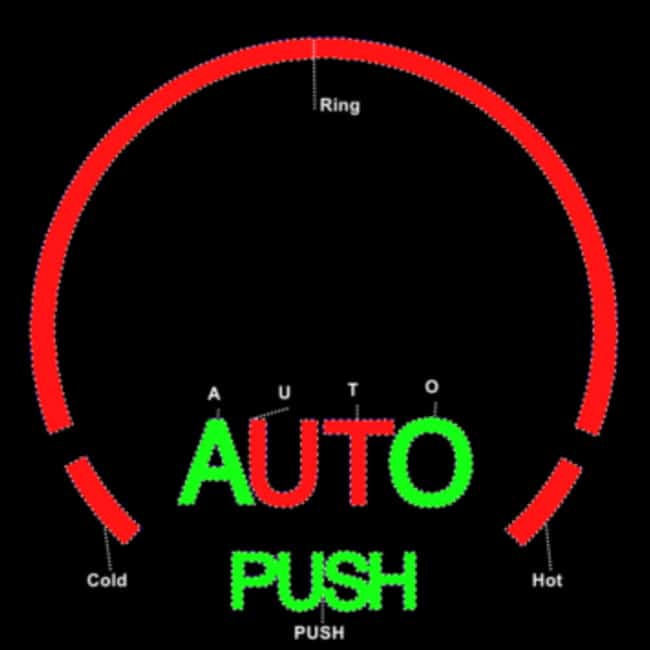
Operators are able use real-time visual feedback in the Light Plate Balancing package, saving time and money. By default: red panel areas are too luminous; blue or black are too dim; and green regions are acceptable. Leveraging customisable colour cues, the operator can direct their attention to balancing only those areas where the graphics will be applied as an overlay.
Key Features
Watch a video of the Light Plate Balancing Software Package in action.
 Simplify the Testing of Vehicle Headlamp Beam Patterns
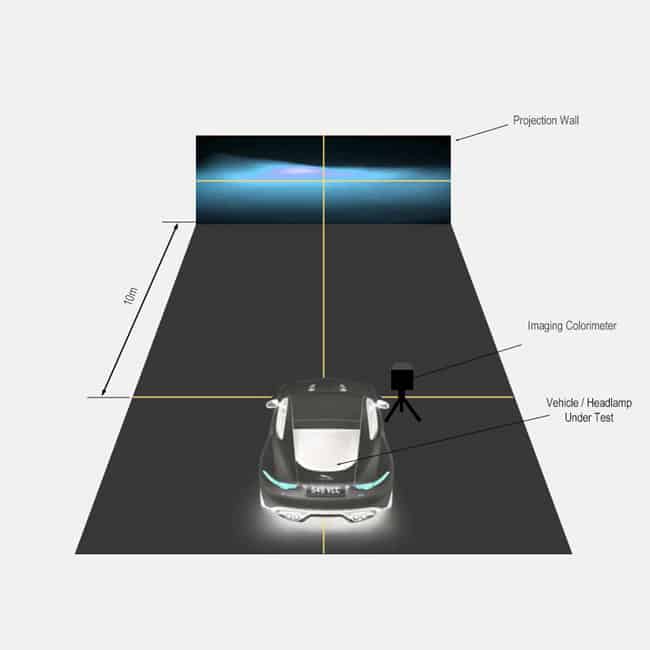
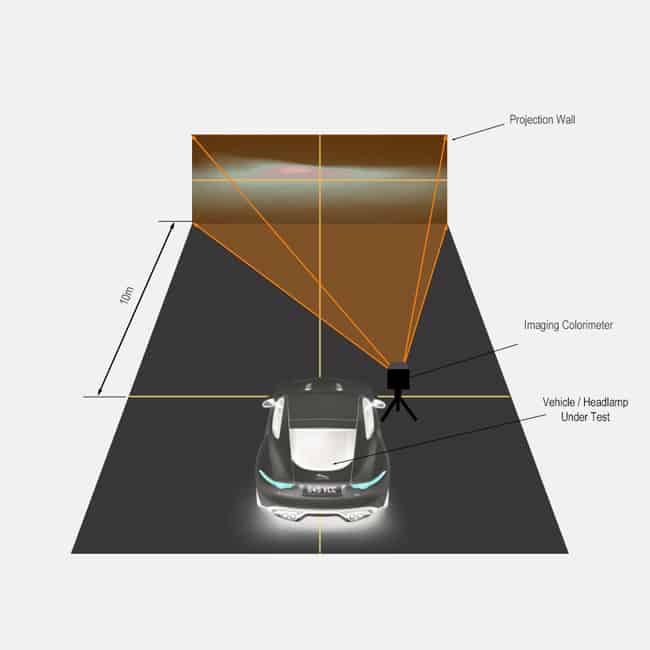
The optional Photometrica Beam Pattern Test Package simplifies the measurement of vehicle headlamp beam patterns as well as the illumination from other directional light sources such as spotlights. Whereas most applications for imaging photometers and colorimeters involve the measurement of the light emitted (the luminance in cd/m²) from the device under test, in this case we are measuring the reflected or transmitted luminance of light shone onto or through a screen, with the aim of indirectly determining the 2D spatial illuminance (in units of lux) or angular luminous intensity distribution (in candelas).
Automotive headlamp intensities are regulated by the UNECE in Europe and by the FMVSS (Federal Motor Vehicle Safety Standards) in the USA. There are two distinct approaches to measuring headlamp beam distributions. You can mount the headlamp on a motorised two-axis goniophotometer (for example an SSL Resource type A/B system available from SphereOptics) and measure the directional luminous intensity for each angle of inclination and rotation. The alternative method is to simply shine the headlamp onto a projection screen and record the beam pattern with an imaging photometer. The projection method has several advantages, not least in terms of lower costs and faster measurements, but also because you can drive the complete vehicle into the dark room without needing to demount the headlamp to place on a goniophotometer.
Key Features
The Photometrica Beam Pattern Package provides a turn-key solution that includes:
The Beam Pattern Package currently includes the following test point libraries for assessing the regulatory compliance of automotive headlamps:
 Simplify the Testing of Decorative Lighting in Vehicle Interiors & Exteriors
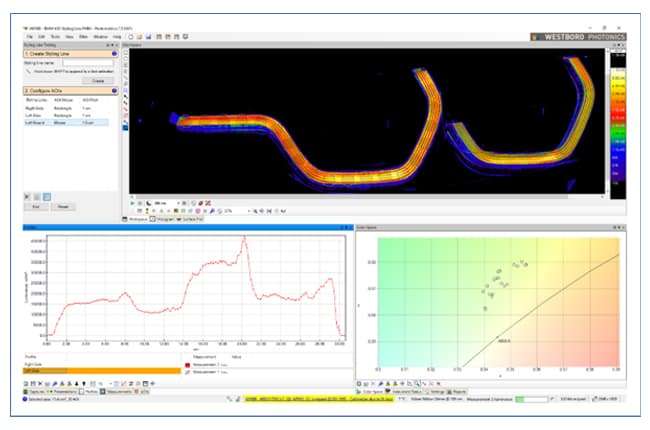
The optional Photometrica Styling Line Test Package simplifies the measurement of curved or straight lighting elements used in both vehicle interiors and exteriors. An example of such an element is a vehicle DRL (daytime running light) where the lit area uniformity of the lightguide is both cosmetically and functionally important.
Linear lighting elements are common in both vehicles and architectural lighting. Assessing the uniformity of a measurement along a straight line can be done using the profile tool in the standard Photometrica Software, but if the uniformity analysis requires a series of measurements along a custom lighting element shape, then the Styling Line Testing package will make life easier.
Benefit from the straightforward creation of areas of interest (AOIs) along a custom path, with straight segments, curves, or even corners. Additionally, define an AOI shape, units (mm, cm, inches, or pixels), AOI width or height, as well as the placement and pitch (distance between AOIs).
Key Features
 Simplify the Testing of Head Up Displays (HUDs)
The optional Head Up Display Test Package extends the analysis capabilities of Photometrica software to include the tests specific to the SAE J1757 (2 NOV 2018) standard, “Optical System HUD for Automotive”.
Key Features
The key features and measurement capabilities of the Photometrica HUD Package include:
Convenience and Alignment
Users testing HUD systems will benefit from the electronic lens control available on the WP6E/S imaging colorimeters. HUD measurements require delicate alignment, and the convenience of changing focus and aperture settings through the Photometrica software will allow users to make the necessary adjustments without disturbing the alignment.